Compartment model for epidemiology
March 14, 2020
This post looks at a compartment model for epidemiology and analyzes the different relationships between the variables in the model. Finally, it draws conclusions about the impact the variables have on the model.
SEIRD-model #
The population is divided into compartments, with the assumption that every individual has the same characteristics. There are a total of five compartments:
- Susceptible ($S$)
- Exposed ($E$)
- Infected ($I$)
- Recovered ($R$)
- Diseased ($D$)
The population flows in the following direction between the compartments.
$$ S \rightarrow E \rightarrow I \rightarrow R / D $$
The model is described as ordinary differential equations with the following variables:
- $β$: how often a susceptible-infected result in exposure.
- $σ$: the rate an exposed becomes infected.
- $γ$: the rate an infected recovers.
- $δ$: the rate that a case that recovers dies.
- $ν$: vaccination ($ν=0$)
- $S$: initial susceptible.
- $E$: initial exposed.
- $I$: initial infected.
- $R$: initial recovered.
- $D$: initial deaths.
These variables are related through the following ordinary differential equations:
$$ \begin{align} \dfrac{dS}{dt} &= -\beta\dfrac{SI}{N}-\nu S \\ \dfrac{dE}{dt} &= \beta\dfrac{SI}{N}-\sigma E\\ \dfrac{dI}{dt} &= \sigma E - \gamma I \\ \dfrac{dR}{dt} &= \gamma I - \nu S - \gamma \delta I \\ \dfrac{dD}{dt} &= \gamma \delta I \\ N &= S + E + I + R + D \end{align} $$
Analysis #
In the analysis the initial population size is $N=100.000$, and will start with one patient zero for all simulations.
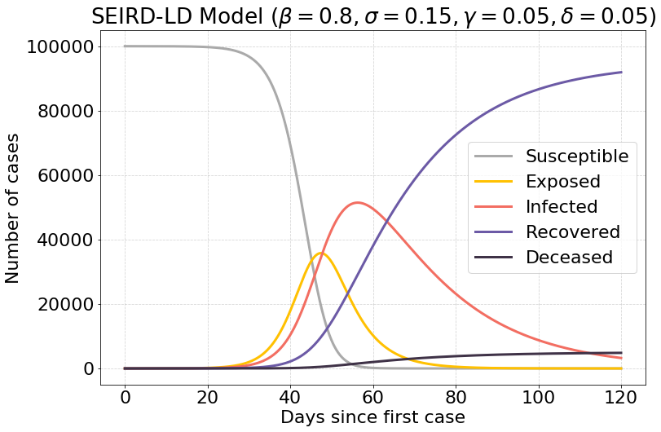
In the first simulation a susceptible-infected exposure has the probability of 80% to become exposed. Once exposed, at any unit of time the case has a chance of 15% to become infected. This given an average time until infection of 6.66 days. There is a probability of 10% to recover per unit of time, whereas 5% of those cases result in death. This means it takes an average of 10 days to recover.
This gives the following initial conditions for the system: $β=0.8, σ=0.15, γ=0.1, δ=0.05$ at $t=0$.
Running this simulation for 120 days gives the following result:
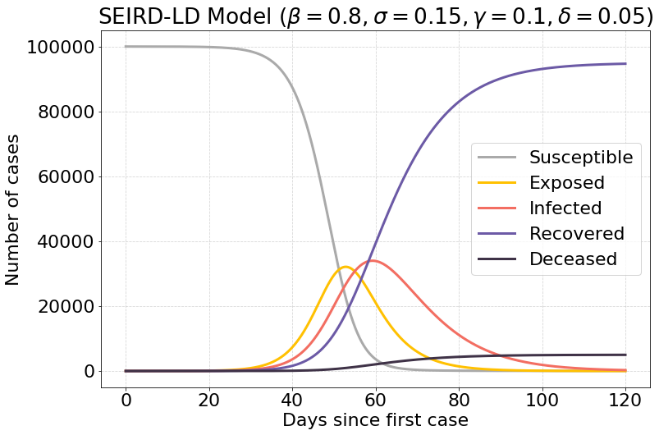
With these initial conditions there are a maximum of around 37.000 infected. Over time the population will move from susceptible (S) to recovered (R).
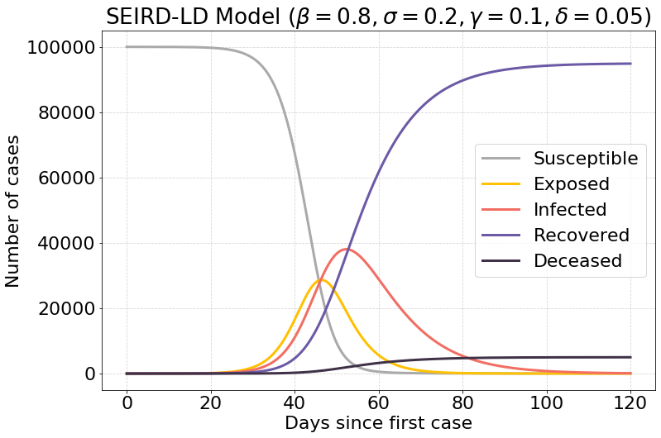
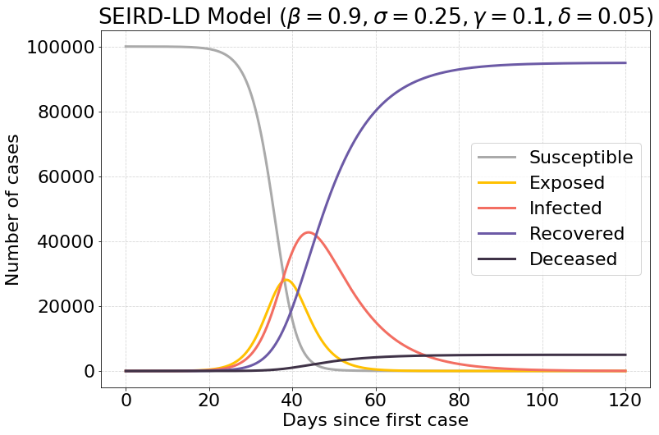
If the value of $σ$ is increased, meaning that exposed people will get infected faster, there is an increase in maximum infected cases. There are about 39.000 infected cases.
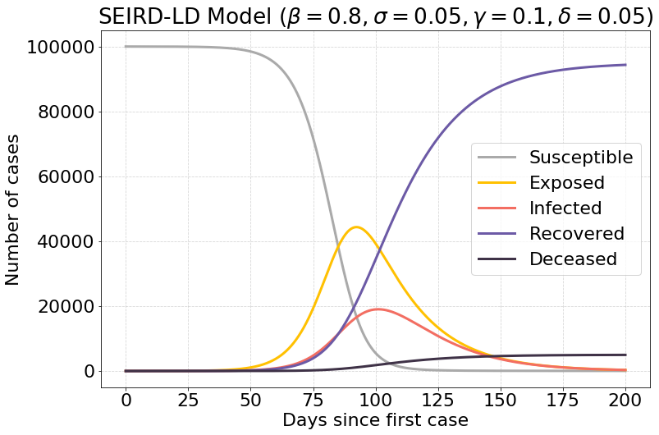
If a lower value of $σ$ is used, the resulting infections are spread out a lot more over time. There are about 19.500 infected cases.
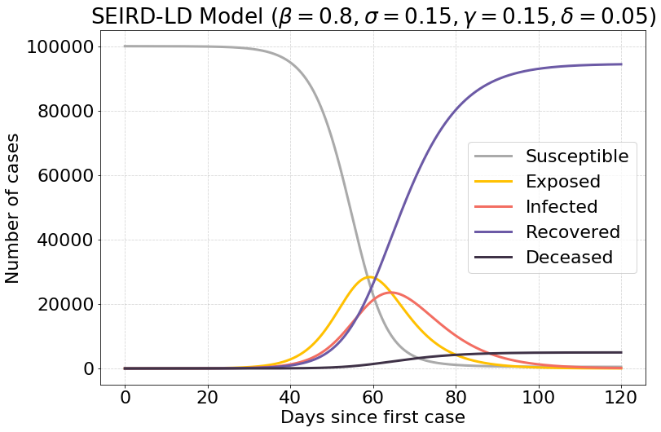
Another interesting factor is the recovery rate $γ$. If the recovery rate increased, there will be a lot less people infected at any given moment. There are about 21.000 infected cases.
If it takes longer to recover, a massive surge is seen in the infected cases. There are about 50.000 infected cases, which is half of the population.
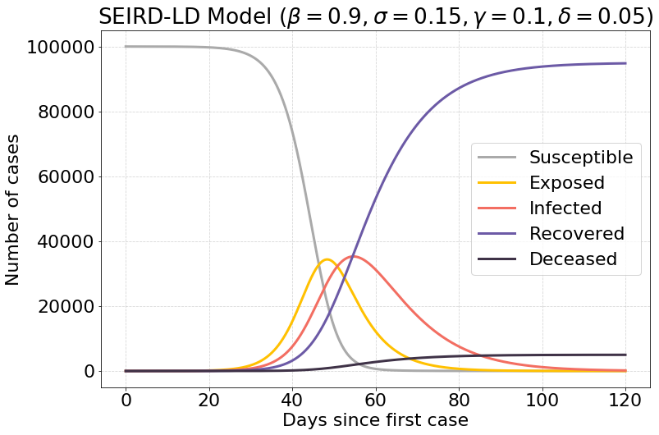
The following model has an increased exposure rate $β$, which means that exposed case are infected faster. This results in 41.000 infected cases.
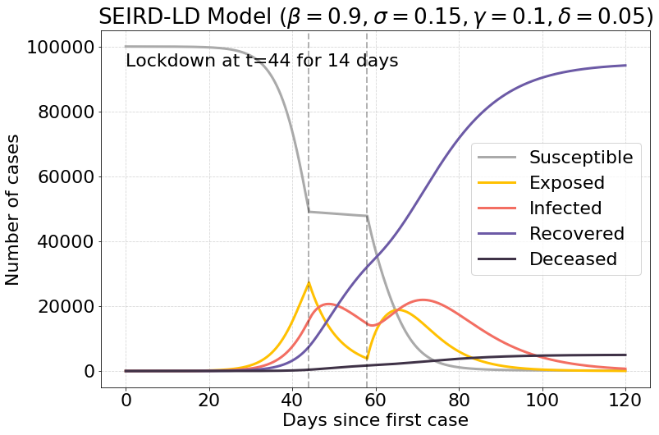
Lockdown #
The following model is the same model as in the previous section. However, after a period of time a lockdown will be in effect. This is modeled by settings $β$ to a very low value during a brief period of time $t$ .
Without the lockdown there is a maximum of 38.000 infected cases, while with a good timed lockdown, there are 20.000 infected cases. This is a reduction of 47.37%.
Conclusion #
The only variable that we can use to have impact on the model is the exposure rate $β$. If we restrict contact moments between humans, we lower the peak of total infected persons. The other variables are properties for the disease, such as how susceptible a human is to infection, how long it takes to show symptoms (and be infectious), how long it takes to recover, and the death rate.
It is also important for a disease to not be too deadly. If a disease is too deadly, the infected will barely have a chance to infect other people, and the disease quickly dies out.
The notebook that has been used to create the plots can be found here.